>>Valley Patriot>>
|
Thinking
Outside the Box
Snookered
Dr. Chuck Ormsby
(07/03/07)
 It is easy to be cynical when it
comes to politics. We have come to expect lies,
distortions and outright misrepresentations. It is easy to be cynical when it
comes to politics. We have come to expect lies,
distortions and outright misrepresentations.
Unfortunately, we now tend to view politics as a sport
and, except for the most egregious violations, we accept
whomever or whatever prevails as deserving of praise and
congratulations despite the legitimacy of tactics,
methods, or claims.
That is sad because truth does matter.
The recent override election in North Andover provides an
excellent example.
A variety of claims were made by the override proponents
– North Andover United (NAU) – during the
recent campaign. One claim was the subject of a 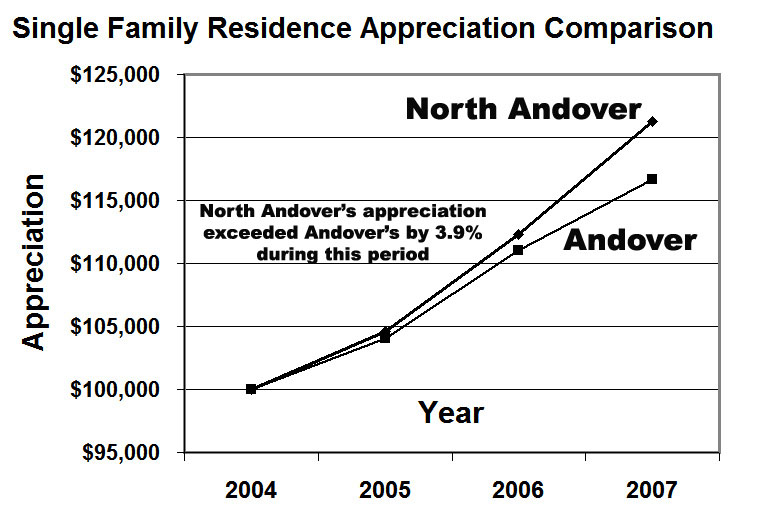 well-designed and
widely-distributed postcard sent at the very end of the
campaign, which left no time for rebuttal. well-designed and
widely-distributed postcard sent at the very end of the
campaign, which left no time for rebuttal.
The claim, seemingly supported by legitimate data, was
that North Andover’s lack of willingness to raise
taxes and provide greater funding for its schools was
responsible for a 17 percent loss of real estate value
since 2002-03 when compared to Andover. The data reported
on that postcard – plus two previous years
conveniently NOT REPORTED by NAU – is provided
nearby (years are mid-June to mid-June).
In reviewing the table, what “% Difference”
value seems to be the most out of step? Could it be the
–2 percent chosen by NAU as its “starting
point”? ALL the other percentages, including the two
preceding values, are between –9 and -16 percent.
Was 2002-03 chosen as the baseline year to create a
perception of a subsequent decline that didn’t
really occur?
Given NAU’s analysis methodology and its claim that
under-funding our schools is causing a decline in our
real estate values, it is particularly odd that in the 12
months immediately following the voters rejection of the
$4 million override in May 2002, we supposedly gained 8
percentage points (from –10% to –2%) in market
value against Andover.
This is the same override campaign during which school
accreditation loss was threatened, 42 teachers were to be
fired, and AP Calculus was going to be eliminated. Now in
2006-07, after having doubled our AP enrollments, our
real estate values plummet? Very odd!
A more realistic assessment of the data indicates that,
over the seven years listed, North Andover property
values have averaged approximately 10 percent below that
of Andover. The variation (standard deviation) of the
estimates of this shortfall, based on the data listed in
the table, is about 4 ½ percent. As we will see, the
existence of any trend, regardless of possible causes, is
not supported by the data.
Let’s determine if there been any change in relative
real estate values between the two towns.
Each data point provided in the table is based on an
average of roughly 5 percent of each town’s
properties. For example, in 2003-04, only 309
single-family properties were sold in North Andover out
of about 6000 on the assessor’s list. If this many
sold properties were randomly selected, the statistical
variation of the results would be about +/-3 percent.
 When differencing two
such sampled results (Andover and North Andover) the
statistical fluctuation in the difference, purely due to
random selection, would be approximately +/- 4 ½ percent
– almost precisely the variation actually observed!
Thus, random sampling of the approximately 300 homes that
just happen to be sold each year is sufficient to
completely explain the fluctuations in average sales
price, even without any other corrupting influences and
without any underlying change in the relative property
values between the two towns. When differencing two
such sampled results (Andover and North Andover) the
statistical fluctuation in the difference, purely due to
random selection, would be approximately +/- 4 ½ percent
– almost precisely the variation actually observed!
Thus, random sampling of the approximately 300 homes that
just happen to be sold each year is sufficient to
completely explain the fluctuations in average sales
price, even without any other corrupting influences and
without any underlying change in the relative property
values between the two towns.
While the fluctuations due to random selection can, by
themselves, explain the variations in the two towns’
property sales prices, there is another effect that can
dramatically increase these statistical fluctuations and
make NAU’s claim even more specious.
New housing developments come in lumps. If in one year
several developments of high-priced homes are completed
and sold, they will dramatically raise the average sales
price. If during a subsequent year, fewer such
developments are completed and an unusually large number
of older/downtown homes are put on the market, the
average sales price will plummet … all with NO
change in your, or your neighbor’s, property values.
This effect explains the two largest excursions in North
Andover sale prices.
Included in the 2002-03 sales data, when NAU is implying
North Andover property values were healthy, are 38
expensive new-mansion sales. But in the 2006-07 period,
when NAU is telling us our property values have
deteriorated compared to Andover, only seven North
Andover new-mansion sales are recorded! NAU’s claim
of a 17 percent decline in our relative property values
for all single-family residences in town is hollow.
So, is there a better way to determine if our real estate
values are lagging?
Each year, our assessors update our property’s
market values. Their assessments are validated by the
Department of Revenue and double-checked multiple ways
for accuracy and consistency with changes in market
conditions.
Statistics derived using this data are not subject to the
fluctuations noted above because they include every
property in town … not just a random sample. New
construction (new growth) is explicitly identified each
year so its distortion of annual real estate appreciation
can be eliminated.
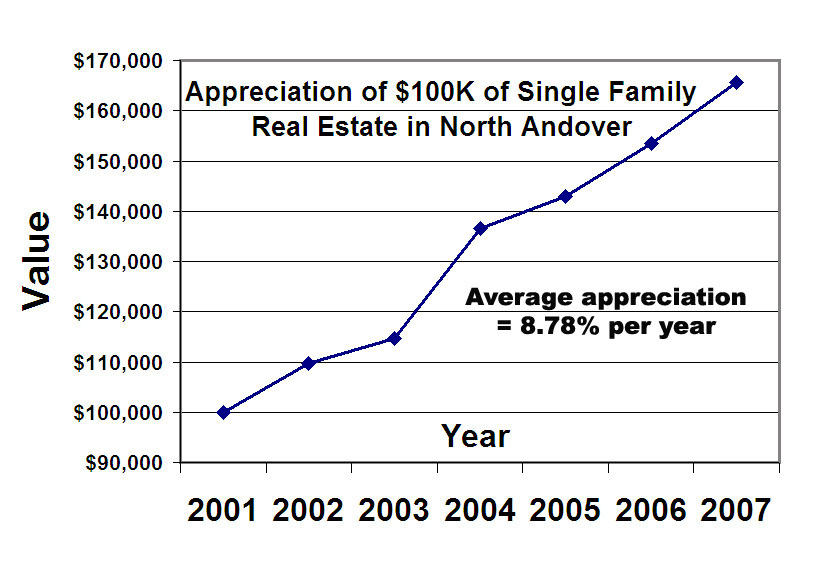
A plot is provided nearby of the appreciation of a
$100,000 investment in a single-family residence in North
Andover starting in 2001. The appreciation each year is
the average appreciation of single-family residences in
North Andover NOT corrupted by any effects of new
construction. As you can see, we have little to lose
sleep over in North Andover.
A note about the large jump in value in 2004: Up until
2004, towns performed town-wide revaluations every three
years. These were required in 2001 and 2004 in North
Andover (the jump from 2000 to 2001 was 25 percent). It
is this author’s understanding that partial
adjustments were made in the intervening years and then
fully brought up to date at each “revaluation”
year.
Thus, the starting point of 2001 can be considered a
fully updated valuation and the appreciation in 2002 and
2003 understated and then fully accounted for in 2004
(thus a 19 percent increase). Starting in 2004, the
assessments in all towns are fully-valued every year.
Assessor’s data from Andover was also obtained.
Andover’s “revaluation” years were 2000
and 2003, so there is no common year when both towns were
fully valued until 2004. Using 2004 as a common starting
point, the nearby chart plots the growth of a $100,000
investment in both towns (new construction effects have
been eliminated).
As noted in the chart, North Andover’s single-family
assessments out-performed Andover’s by almost 4
percent over these three years. For a $500,000 home, that
extra appreciation is worth $20,000 … and we saved
on taxes also!
How accurate is the estimate of this gain? I’m not
certain, but there is clearly no indication of a relative
loss of value and nothing can be attributed to our taxes
being too low or our schools being under-supported.
North Andover United’s last-minute postcard was
designed to mislead the voters. We were snookered.
Was it a lie? A white lie? A fib? Were their fingers
crossed behind their backs? Or was it just a cynical
political ploy to raise our taxes for their benefit?
Congratulations to proponents of the override. They
published a last minute distortion and will, forever
more, be able to confiscate $1,650,000 (plus a 3 percent
CPA surcharge and additional 2 ½ percent yearly
increases thereafter) from our citizens.
Taking property based on purposeful misrepresentation,
even with the owner’s consent (e.g., our vote on
June 19th), is called fraud.
Advocates of higher taxes wonder why the town is so
divided. Maybe the division is between honest citizens
and those who just want to get what they want … by
whatever means necessary.
Remember this every time you pay your North Andover real
estate tax bill.
Dr. Ormsby is a member of the N. Andover School
Committee. He’s a graduate of Cornell and has a
doctorate from MIT. You can contact Dr. Ormsby via email:
ccormsby@comcast.net
*Send your questions comments to ValleyPatriot@aol.com
The July 2007 Edition of
the Valley Patriot
The Valley Patriot is a Monthly
Publication.
All Contents (C) 2007, Valley Patriot, Inc.
We publish 15,000 newspapers and distribute in Andover,
North Andover,
Methuen, Haverhill, Chelmsford, Georgetown, Groveland,
Boxford, Amesbury, Newburyport
Lawrence, Dracut, Tewksbury, Merrimack, Newburyport,
Westford, Acton, and Lowell.
Hampton & Salisbury Beach, (summers
only)
|

Valley Patriot Archive
Valley Patriot Story
ARCHIVES
Prior Lead
Stories
Prior
Valley Patriot Editorials
Prior Columns by ...

Tom Duggan
Dr. Chuck
Ormsby
Paula
Porten
Ralph
Wilbur
Hanna
Ted Tripp
Valley
Patriot of the Month
Griselsilva.com
Patrick
Blanchette
D.J.
Beauregard
Jim
Cassidy
D.J. Deeb
Marcos
Devers
Bob
Desmarais
Regina
Faticanti
Jim
Fiorentini
Bill Kelly
Wilfredo
Laboy
Peter
Larocque
Vilma Lora
Ed Maguire
Billy
Manzi
Paul
Murano
Mark
Palermo
Hartley
Pleshaw
Debbie
Quinn
Raise Em
Right
Dr. Peary
Kathleen
Corey Rahme
Barney
Reilly
Angel
Rivera
Jim Rurak
Grisel
Silva
Mike
Sullivan
Sandra
Stotsky
Mike
Sweeney
Ken Willette
Scott Wood
Jim
Xenakis
|